Want to Know How to Properly Measure Financial Inclusion? Copy the Retailers.
(Editor’s note: This is the third in a three-part series by insight2impact (i2i). Click here for Part 1 and here for Part 2.)
In 2014, the Bank of Ghana granted permission for reduced know-your-customer (KYC) requirements for a new Fidelity Bank product that targeted consumers at the bottom of the pyramid. The product, Smart Account, required only one form of national identity and no additional document to open the account, and so became a flagship product for financial inclusion in the country. Fast-forward to February of this year, when the bank announced its decision to remove this product from its offerings. In less than two years, a flagship innovation was discontinued. What went wrong?
The learnings from this example tell us as much about what we measure in financial inclusion as how we design and deliver products. The success of the Smart Account product introduced by Fidelity Bank was measured early on by the number of accounts that people were opening, not how they were being used. Opening an account incurs costs for providers, which providers intend to recoup when consumers use the accounts. When the account isn’t used, providers are unable to recoup their costs for opening, and keeping open, accounts. So the sustainability of the product is undermined.
This example is not unique to Ghana or Fidelity Bank. Similar challenges have occurred with large-scale government initiatives in South Africa and India. These initiatives are an important catalyst for further financial inclusion, as they address the primary issue, which is getting people into the formal system. However, the journey to financial inclusion impact is complex and requires consumers to go beyond take-up of a product or service. In other words, take-up is a necessary, but not sufficient, condition to guarantee optimal use of such a service.
In our i2i measurement work, we scanned existing frameworks and consulted key industry stakeholders to conclude our focus on measuring usage as the next step to achieving financial inclusion outcomes and impact. For policymakers, usage is important for achieving broader public policy objectives. Adults use financial services that they get value from. For providers, usage is important for the viability of their business models.
To inform our understanding of usage and how to measure it, we looked outside the industry to the retail sector. Retailers are at the forefront of how to collect and analyze data on how consumers engage with their services, particularly as it relates to loyalty programs and loyalty cards offered to consumers. The analysis of such data has allowed retailers to understand key usage indicators fundamental to their business, namely recency, frequency, monetary value and duration or lifetime value.
In our work, we’ve applied these indicators to measuring and understanding the extent and intensity of the use of financial services.
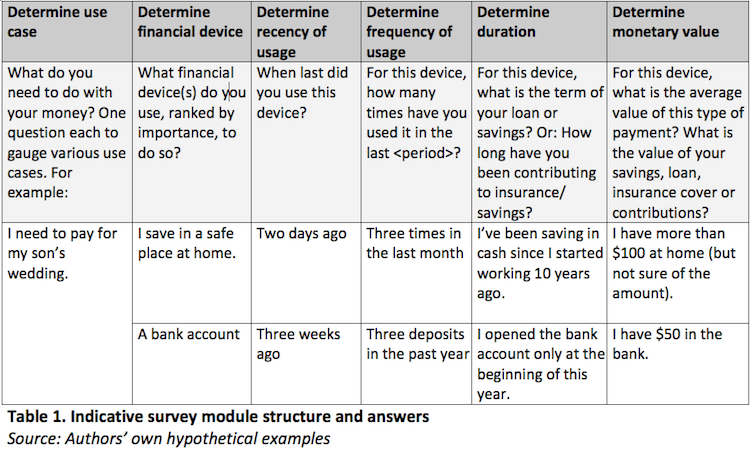
- Recency: When was the financial service or product last used? This reflects the current value or lack thereof that the product has for the user and is a core metric for retail products and services.
- Frequency: This measures the number of interactions over a defined period and reflects the ongoing usefulness, cost and scope of usage.
- Monetary value: This measures the size of deployment in monetary terms and includes both physical money (notes and coins) and electronic value.
- Duration: This is the length of time the person has used the financial service or product. This may be captured as the term of a product, such as a loan or savings product, or as the persistence of use, such as for insurance or payment devices.
Table 1 below shows how these indicators are incorporated into our needs-based usage measurement framework to understand how adults use financial services. It outlines a proposed survey module, which builds on the use case approach developed in our concept note to collect relevant metrics to understand the scale and nature of usage.
Currently, we’re testing and refining this framework with demand-side surveys and supply-side data from providers or governments. For example, in Zimbabwe we’re partnering with XDS, a credit and information bureau, to examine repayment behavior and the usage of credit devices, as well as investigating the key determinants of uptake and usage. This supply-side data enables the four usage metrics of recency, frequency, duration and value to be objectively analyzed. We’re also planning to complement it with demand-side data to complete the picture, by providing usage metrics on informal alternatives. Together this can help providers and policymakers locate the nature and scale of account usage in perspective relative to the full financial life of those customers.
This, in turn, will enable us to better understand, and therefore inform, policies and business models tailored to financial needs.
If you’re interested in partnering with us to test these indicators or in learning more about our work, please contact me at richard@i2ifacility.org.
Richard Chamboko is an engagement manager in the measurement team at the insight2impact (i2i) data facility.
You May Also Be Interested In:


- Categories
- Uncategorized
