Women Are Paying More for M-Pesa: A Gender Analysis of Mobile Money Fees in Kenya
The cost of using financial services is a key barrier to their adoption and use in low- and middle-income countries. While mobile money systems dramatically reduce overall costs compared to traditional banking (e.g., bank branches), customers still have to pay fees for many types of transactions. For financial inclusion stakeholders, understanding how these fees impact usage is key to developing policy or system design approaches that mitigate negative impacts.
With financial support from The Bill & Melinda Gates Foundation, Caribou Data contributed to a comprehensive study of how payment system design — specifically, the Level One Project principles — could impact gender bias in digital financial services (DFS). Using the Caribou Data platform, we collected anonymous activity data from representative panels of study participants across five countries — Bangladesh, Côte d’Ivoire, Kenya, Nigeria and South Africa. The analysis featured here is specific to Kenya, but the full report covers all five countries and a wide range of topics, while an extension of the original work, supported by FSD Kenya, is also available for download.
Follow the money
We focused this analysis on the Kenyan market, where the quasi-monopoly status of M-Pesa results in a more internally consistent data set. And we focused only on person-to-person (P2P) transactions, which have straightforward pricing and are common to almost all mobile money users. The resulting data set equaled approximately 31,000 transactions from 890 study participants. Note that the data represented here are from 2019 and early 2020 — before the Kenyan government asked mobile money providers to raise the threshold at which they start charging transaction fees, in an effort to facilitate more mobile money transactions during COVID-19 restrictions.
With M-Pesa, as with almost all mobile money systems, the fee in a P2P transaction is paid by the sender; the receiver pays no fees, unless and until she cashes out the funds. The M-Pesa fee structure for P2P transactions is tiered, with a free band for all amounts of Ksh100 and less (prior to the temporary pandemic-related fee changes mentioned above). We visualize this fee structure below.
![]()
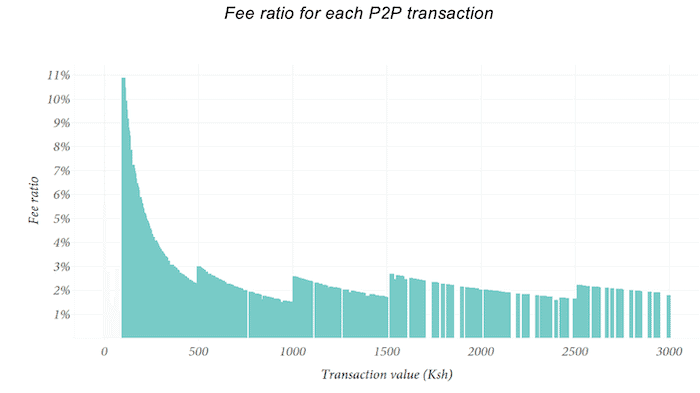
In order to understand the relative amount of the fee paid, we next calculate the fee ratio for every transaction — i.e., the amount of fee paid divided by the transaction value. The chart below shows how the tiered fee structure results in a variable fee ratio. Notably, the smallest transaction values above the free tier incur the highest fees as a proportion of the payment. For example, the worst payment amount to send someone is Ksh101, which incurs a Ksh11 fee, or almost 11% of the value. Note that gaps in the chart simply reflect value denominations for which our data set did not record any transaction.
This is a regressive fee structure, in that it effectively penalizes lower value transactions, which are more likely to be made by lower-income individuals. A study by IPA showed that these tiered, regressive structures are the most common across providers and markets. They note that the advantage of tiered structures is that they are easy to understand and communicate; for any given transaction amount it is relatively easy to look up the amount of the fee. Percentage-based fee structures (e.g., 1% of any amount), on the other hand, require a calculation that may serve as a barrier to some users.
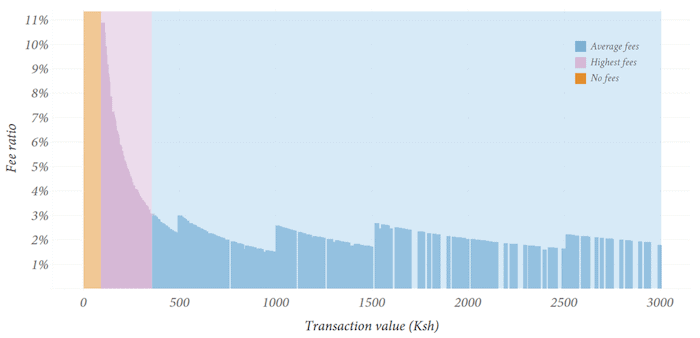
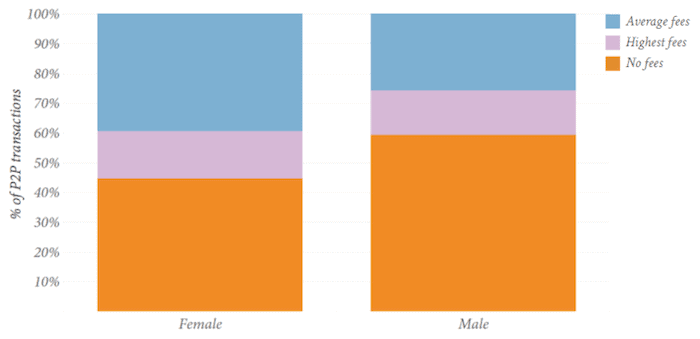
To get a better understanding of the demographics of usage, we first segment these fee ratios into three groups: no fees, highest fees and average fees. The “no fee” segment is all transaction values from Ksh1-Ksh100; the “highest fees” segment is those from Ksh101-Ksh450, where the fee ratio ranges from 3-11%; and the “average fees” segment is any transaction of Ksh450 or more, where the fee ratio varies but averages about 2%.
We then visualize all transactions disaggregated by gender, showing the distribution of transaction value amounts by women and men. For both genders, the vast majority of transactions — around 20-25% — are for Ksh100, which is the highest value one can send without a fee.
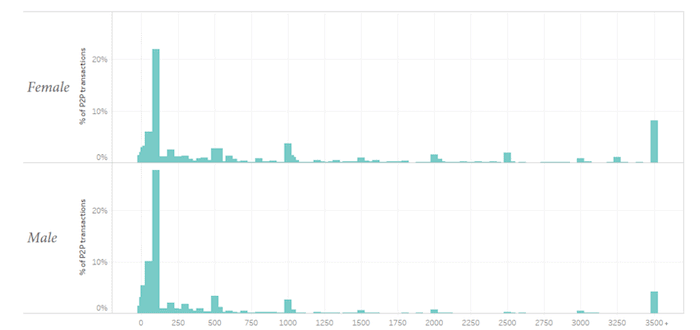
If we map our three fee-ratio segments onto this distribution, we can begin to see how payment behavior is shaped by fee structures. Both women and men try to make free transactions when possible, and both are relatively good at avoiding the “highest fee” segment.
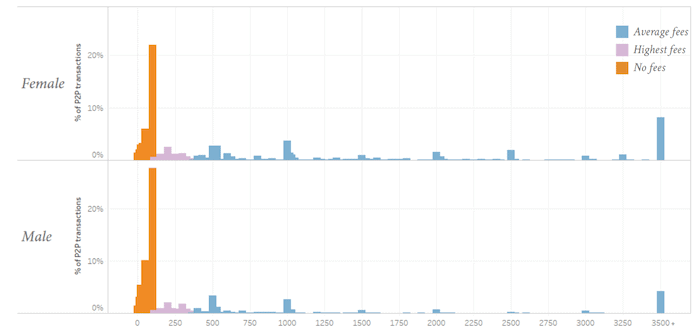
Finally, to better compare the genders, we show all transactions in a stacked bar according to the fee ratio segment. We can see that for both women and men, only about 12% of their P2P transactions are in the “highest fees” segment. But there is a substantive difference in the share of transactions in the “no fees” segment — amongst men, a full 60% of transactions are fee-free, while for women, that share is only about 40%. The result is that women in Kenya pay more in P2P fees, on average, than men do, about Ksh11 per transaction vs. Ksh7 per transaction.
Of course, P2P fees are only one part of the picture when it comes to the costs of using mobile money — customers also incur fees when paying bills, taking loans or advances (such as through M-Pesa’s Fuliza offering), or especially when withdrawing funds from an agent. Ghanaian analyst David Quartey takes this kind of analysis one step further with his study of end-to-end transaction costs for both sending and withdrawing money across different mobile money providers in Ghana, providing a more complete picture of a typical use case.
Implications
With this data set, we can’t divine why women make fewer free payments. One interpretation of the data is that women are less likely to be aware of the fee structure, and therefore make more transactions above the fee threshold. This seems unlikely, however, given the deep penetration of M-Pesa and how long the fees have been in place. Another possible explanation is that women are aware of the fees, but are less comfortable with fee avoidance behavior — e.g., sending multiple smaller transactions below the threshold instead of a single, larger payment. We know from our fieldwork on this topic that many women feel more comfortable using an agent to help facilitate transactions, in which case the sender might not want to ask the agent to help them make multiple transactions. Or the difference might simply be that the female participants in our study had less time and patience to deal with fee avoidance tactics and were content to pay the fees in exchange for the time savings and convenience.
Whatever the cause(s), this difference in P2P payment behavior seems worthwhile to explore, if not because of the actual difference in fees paid — which in absolute terms might not be highly consequential — but because uncovering the drivers of the behavior could illuminate more of the complex challenges facing women using DFS.
Bryan Pon is a co-founder at Caribou Data.
Photograph courtesy of WorldRemit Comms.
You May Also Be Interested In:


- Categories
- Finance, Technology, Telecommunications
