Too Good to be True?: Is the Global Findex survey overstating growth in financial inclusion?
Since it was published a few weeks ago, the 2014 Global Findex financial inclusion report has made a splash in media around the world. The headlines may have differed, but the articles all mention the key finding from the press release published by the World Bank: Massive Drop in Number of Unbanked. According to the Findex survey, which covered more than 150,000 people in 143 economies, the number of people with financial access grew from 51 percent to 62 percent between 2011 and 2014, a shift that reportedly represents a total of 700 million people worldwide.
While we highly appreciate the survey and the light it shines on the state of financial inclusion across the world, we are concerned about the accuracy of this headline finding. The growth it suggests is almost certainly overstated. To illustrate this concern, we suggest an alternative news headline, also based on the survey findings:
Number of Unbanked in U.S. and Eurozone Cut in Half
U.S. unbanked population drops from 12 percent to 6 percent in 2011-14; Eurozone cuts number of unbanked from 9 percent to 5 percent, according to report.
If this headline seems removed from reality, that’s because it is. The retail banks in the U.S. and the Eurozone have been around for over 100 years, yet the Findex figures put the growth of bank accounts on par with the growth of cellphones. By contrast, a survey by the U.S. Federal Deposit Insurance Corporation finds the number of unbanked nearly unchanged between 2009, 2011, and 2013. The numbers are even more startling in Greece and Italy, where results from Findex suggest that despite the economic headwinds, 10 percent of Greeks and 16 percent of Italians became new bank customers in 2011-14 – outpacing growth in countries like Peru and China.
So what’s the problem with the Findex findings? This is the second installment of a triennial global survey. In its first release, for 2011, Findex provided something no other data source had: an ability to cross-compare the majority of countries in the world on key indicators of financial inclusion. The new installment repeats this exercise for 2014, adding another critical lens: the ability to track trends over time. Both sets of surveys were — or will be — released in two steps: country and regional aggregates calculated by the Findex team, and six months later, the raw microdata — providing every single answer to every single question.
We have been active users of Findex data, including the microdata, since its first publication, and have been working with it intensively since the new release. It’s an invaluable resource, and exactly because of its importance, its findings should be as accurate as possible.
We believe it is in the aggregation step that the headline-writing began to diverge from reality. Below we show the changes in account ownership (including mobile accounts) over the two periods covered by Findex:
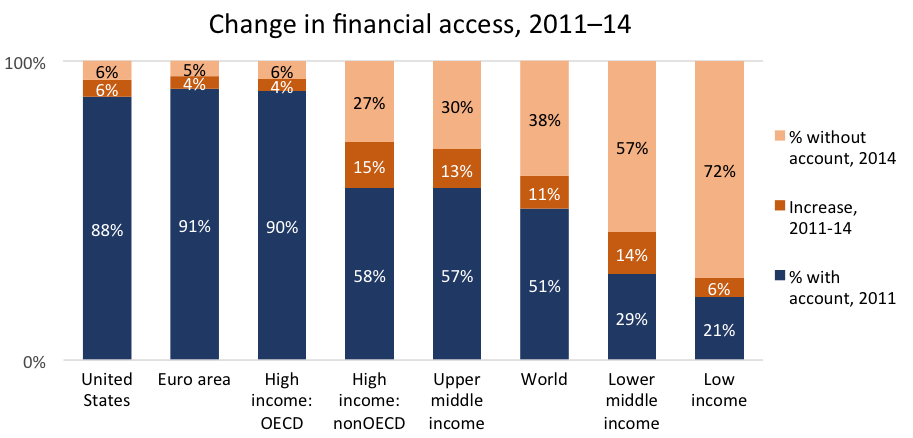
At first, nothing seems amiss about these trends. Growth is highest in middle-income countries, slower in upper income ones – in line with adoption rates for most products and services, where growth is high during the middle stages of market development and slows as markets mature. One would expect that when large numbers of families move from poverty into the bottom rungs of the middle class, many will become clients of banks. On the other hand, in high-income countries with mature financial markets, growth should be very slow.
This is where a closer look shows some peculiar figures – the growth of financial access in high-income countries may be in the single digits, but the impact on the size of the unbanked population is large indeed. Reversing the perspective and considering the change in the unbanked population clarifies the point:
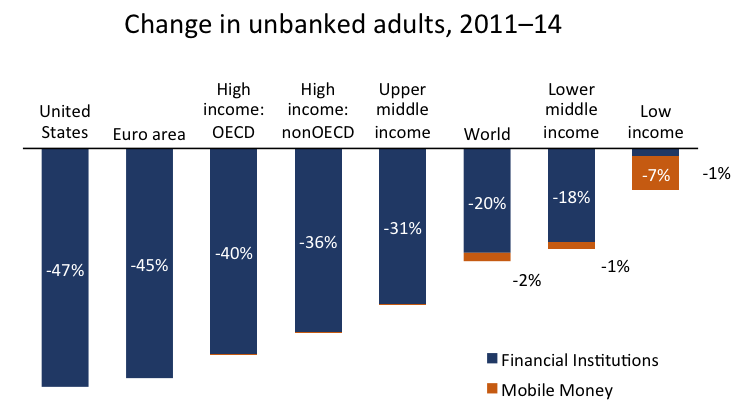
Little has happened in either the U.S. or Europe to suggest such large shifts. On the contrary, this has been a period of economic stagnation, particularly in Europe, which makes large increases in financial inclusion especially unlikely.
The evidence strongly suggests that there is an upward bias in the trend calculated from the 2011 to the 2014 Findex dataset. And because the share of the unbanked is already smaller in rich countries, the impact of this bias is magnified in places like the U.S. and the Eurozone, thus creating the unexpected changes in the unbanked population.
Breaking down the growth
Using the Findex data, we can break down the apparent global growth in financial inclusion into three basic categories: traditional channels, mobile money and population change. Together these add up to 716 million new clients, with 160 million clients coming from population growth, 41 million from mobile accounts, and the remaining 515 million from growth via traditional channels: banks, financial cooperatives, post offices and the like. These numbers differ slightly from those in the Findex headlines and the survey report due to apparent rounding.
Since high-income countries make negligible use of mobile money, if there is over-estimation in the Findex totals, it must then be in the traditional channels category. One plausible source of this over-estimation is a change in the definitions of an account holder.
In 2011, an individual was marked as having an account by answering yes to either of two questions: “Do you have a bank account” or “Do you have a debit card.” In 2014, five more questions were added, covering various payments made to or from a bank account. A person answering “yes” to any one of these five questions – even if they answered “no” to actually having an account – would be counted as an account holder. The approach appears to be aimed at capturing those who use accounts, but for various reasons may neglect to mention it when asked if they have one.
There is a sound reason for expanding the definition, namely, to obtain a more accurate counting of people with access to formal financial services. But since the definition broadened between surveys, it is hard for those of us who lack access to the microdata to tell how much of those bump-ups in financial inclusion reflect changes in the survey rather than changes among the surveyed. The Findex report acknowledges this – a footnote states that these additional questions counted 2.77 percent more of the world’s people as having an account. That’s 141 million individuals, or about a quarter of the reported global gain.
However, because the impact from this definition change is only provided at the global level, we cannot determine whether it or something else caused the high apparent growth in the U.S. and Eurozone. And so long as that question remains unanswered, it throws into doubt the growth figures for all countries.
As mentioned earlier, we believe these issues may arise in the aggregation process and may not necessarily reflect problems with the survey itself. With the promised publication of the microdata six months from now, we should know for certain. However, given the importance and high visibility of the headline growth figures, it is important that data clarifying these figures are provided more expeditiously.
The core value of Findex is to enable data-supported decisions for those involved in financial inclusion. There are many questions that would benefit from this deeper understanding: for instance, why is financial inclusion in low-income countries growing so much slower than in middle-income ones? And what are the factors behind these differences – are they the result of specific policies or simply a byproduct of broader macroeconomic trends?
Unfortunately, until the data issues can be clarified, answers to these and other questions will remain unreliable.
Daniel Rozas is an independent microfinance consultant and co-founder of the MIMOSA project, and a staff member of the European Microfinance Platform (e-MFP). David Roodman is a development economist based in Washington, D.C., and has been assisting in the MIMOSA project.
Photo courtesy of Dean Hochman.
- Categories
- Education, Impact Assessment
