A Curious Landscape: Visualizing data on the India Map of Financial Inclusion
Which districts have the highest concentration of financial inclusion actors? How does the coverage of these services correlate with the basic demography and infrastructure across a given country?
In the previous post in this series on MIX’s India Map of Financial Inclusion, we explained how some initiatives, like the Pakistan Microfinance Network (PMN)’s MicroEye and CGAP’s Global Findex are answering these questions through data visualization, as well as how MIX is building a platform for such inquiry in India. Through these tools, MIX, PMN, CGAP and others are providing MFIs, investors, policy makers, researchers a lens through which to gain a new type of insight on financial inclusion. In the same spirit, and created with support from the Citi Foundation, the India map unites various financial inclusion-related datasets in India on one interactive platform. Users may now toggle through data layers and compare geographic concentrations of points of service against demographic information. As a visual for more than 600 districts in India, the map is now in the second rendition of its ongoing development and, as such is starting to point to some intriguing areas for further inquiry.
As MIX continues to capture data and add layers time-bound data on top of each other, deeper insights will emerge. But even in the early going, the map is offering unique insights that beg for deeper investigation. General observations and analysis from several of the map’s datasets reveal the following:
-
Microfinance institution (MFI) presence per district: Districts with MFI presence range from just one branch to almost 90 in some areas, as is the case in some parts of the south, like Andhra Pradesh and Tamil Nadu. Most districts with urban centers have surprisingly low presence, considering their high population. However, certain cities like Nagpur, a city in central India, remain anomalies, hosting 34 branches. Spandana, one of the largest MFIs in India, has more than half of all the branches in central and south India, with the exception of Tamil Nadu and Kerala. Sizable but limited pockets of MFI branches exist in the north central area and around Kolkata. In some cases, the presence of MFIs drops significantly from one district to another. These findings beg the questions: What causes certain districts to be favorable to MFI proliferation? How might (or might not) MFI presence be correlated with certain demographic data?
-
Mobile telephony: Districts with strong mobile telephony networks do not appear to correlate with the presence of MFIs or banking correspondents (BCs). Why aren’t financial service providers leveraging mobile telephony?
-
Banking Correspondents (BCs) seem concentrated along the Ganges: When examining the layer of BC information, the most obvious concentration of high-percentile bubbles is strewn across the north central part of India along the border of Nepal. The armchair geographer knows this as the Gangeatic Plain, the flat, tropical watershed of the Ganges River. With geographic similarities to Bangladesh and a tendency to transform into a flood plain, the majority of BCs are located here. Yet, MFIs are conspicuously sparse, unlike Bangladesh, which is known for its high penetration of MFIs. Why do the BCs flourish here? Why are the MFIs less present in this area, especially when institutions have been so successful in similar geographies just across the border?
-
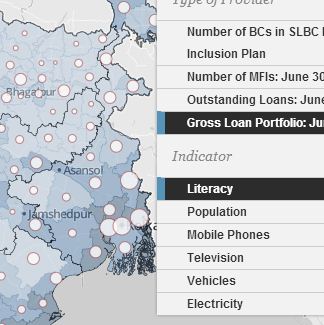
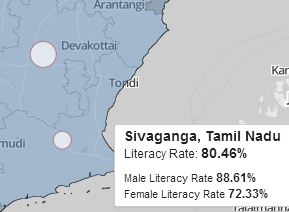
Literacy rates: Female literacy does not appear to correlate with financial inclusion data. In some cases there appears to be a negative correlation. Is there a population literacy rate that is “ideal” for low-income financial products and services? Do districts with a certain range of literacy tend to attract (or repel) MFIs or BCs? Could high literacy be an indicator that populations are already banked?
-
White spots: Some white spots, or areas with no services, appear as expected in areas known for low infrastructure, remoteness and poverty. Meanwhile other white spots are not so easily explained. There are pockets of “untouched” areas throughout the country, likely for a range of reasons. What comes as a surprise is the heavy concentration of MFIs and/or banking correspondents throughout the geographically isolated Ladakh region or the remote areas of Assam, which border China. What has prevented the expansion of services to some districts?
While any of these questions demand rigorous testing as a next step, the India Map of Financial Inclusion lends credence to what we already know: the lives of low-income people are deeply complex in terms of the local supply of financial products and services. As of now, the map cannot tell us barriers to access on an individual level or dive into usage rates or other related information. However, it can, for the first time, uncover possible lines of questioning that may begin to paint the picture of financial services across India. We believe in the potential of that starting point as a means to support investment, business planning, research and policy for improving financial services for the base of the pyramid.
Stay tuned for our next post in which we unwrap some of these points and others, both for India and our new Financial Inclusion Map of Rajasthan.
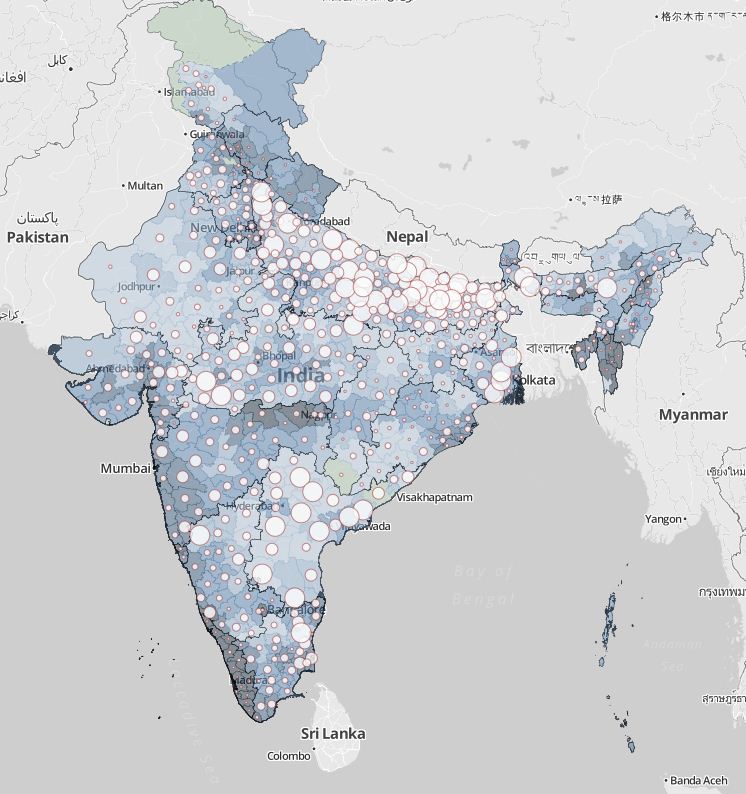
A screenshot of the full India Map:
- Categories
- Education, Impact Assessment, Technology
- Tags
- microfinance, research
