Linking the Needs of Customers and Providers: A Framework for Effective Financial Health Measurement
As a financial service provider (FSP), one of the difficulties we at Lakshya have faced while working to improve financial health for low- and moderate-income (LMI) segments in India is figuring out ways to measure it. The problem stems from several unresolved challenges, including:
- Financial health impacts are primarily visible in the long term, making it more difficult and costly to conduct studies, and to adjust products or tactics in response to their findings;
- FSPs’ business-focused key performance indicators may not be aligned with the LMI segment’s financial health – e.g., they may face pressure to increase their loan portfolio despite these loans’ impact on the debt-to-income ratio of LMI customers.
- Users often have more access to, and a greater preference for, informal financial institutions, whose transactions are not visible to formal FSPs.
But there’s another issue that may be even more prominent: Most financial institutions are not clear on the business benefits of making an upfront investment in measuring users’ financial health. One of the reasons for this is that their financial health measurement methodology and metrics do not account for variations between different user groups. As a result, these businesses are not able to link the most relevant metrics to any interventions that might improve the financial health of these diverse groups. And ignoring these group differences by employing the same financial health metrics across the entire FSP will not solve this issue.
By following the three key principles below, FSPs can account for the distinct needs of different user groups, developing a financial health methodology that allows these businesses to link customers with specific interventions to impact their financial health.
Principle 1: The direction and pace of users’ financial health will differ
LMI users are characterized by income variability and a weak (or nonexistent) safety net, which makes it difficult for them to manage urgent financial shocks. However, the financial health of LMI segments is fluid, so irrespective of where these users lie in their financial health journey today, they can move in four plausible ways, as shown in figure 1 below:
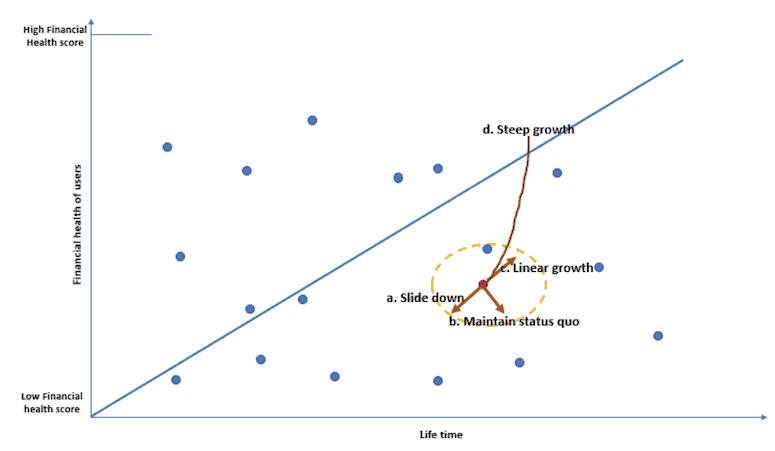
Fig 1: Four plausible directions of a user’s financial health
- Slide down: Users may make a constant effort to move up the financial health ladder, but there are many circumstances that can pull them down, including hospitalization, an accident in the family, the loss of a job, a big expense like a funeral, etc.
- Maintain status quo: Users’ primary focus is to maintain their current financial health status by securing a safety net and constant income source. At this point, they do not have the intent or capability to further improve their financial health status.
- Linear progress: Users can exhibit steady growth, climbing up the ladder of financial health at a steady pace by taking prudent steps to improve their financial health in the future – e.g., young users investing money as their income increases year by year. Though these users will likely see linear improvement in their financial health, it can change in the future.
- Steep progress: Users can show steep growth in their financial health, since they have gained additional income sources or reduced their expenses. These users are also willing to put their extra gains toward improving their financial health – e.g., reducing the cost of a significant item like rent by buying a home.
Since users in the “slide down” category face unique challenges, we are keeping that segment out of this article and will focus on the remaining three. FSPs can improve the financial health of these segments in one or all of the following ways:
- By managing users’ resilience – i.e., providing products that meet their urgent financial needs: This is the first and foremost requirement in order to (at least) maintain the status quo of the user’s financial health. It may be triggered by a user’s loss of savings, or by users taking high-cost debt in the absence of insurance to meet their urgent needs. To address this, practitioners can focus on offering a variety of financial tools to enable users to navigate emergencies, including basic health and life insurance, and unsecured credit at affordable interest rates. Users’ ability to manage these urgent needs could change depending on their culture and geography, so institutions need to define what financial products will help different user groups to maintain their status quo and not slide down the ladder from their existing financial health position.
- By enabling users’ linear progress: What happens once a user’s basic financial needs are secured? How can providers support them if they have maxed out their income potential and/or have no means to reduce their household expenses (a scenario that might well be true for the majority of users)? How can FSPs aim to maintain steady progress on these users’ financial health ladder – and more importantly, what constitutes “steady progress” in the first place? One approach is to focus on the important milestones at different stages of a user’s life, providing products that are relevant to these stages – e.g., annuity products for users in old age, incremental increases in loans to expand younger users’ businesses, etc.
- By opening the opportunity for steep progress: This category is most applicable for highly motivated users who are keen to move up the ladder faster. FSPs can serve these customers by offering products that enable increased income or reduced recurring expenses, thereby freeing up extra resources for users to deploy toward improving their financial health. For example, FSPs can ensure these users’ ability to access formal loans to add another income source, or to acquire a productive or cost-saving asset. This can improve their financial health substantially, provided the user invests this new capital in the future. And this solution doesn’t have to involve credit: Something as simple as financial tracking, which makes users more financially prudent, can work wonders for some users. The key is to define what will help a user group to create steep progress, and to determine if it is within the ability of an FSP to provide it, either on its own or via partnership.
These categories are incremental: Positive movement in “enabling linear progress” will likely happen when FSPs have improved users’ status quo by “managing resilience.” Likewise, steep growth could become a priority when the other two goals are fulfilled.
But FSPs may not always be able to aim for incremental improvement in financial health across these three categories. Depending on their business model, they might target specific financial health categories instead. For example, some microfinance institutions may aim for only “linear progress,” since they provide only incremental loans to expand customers’ businesses. Similarly, insurance-based fintechs may target only “managing resilience.” And low-cost housing finance companies may pave the way for steep progress by enabling home purchases that significantly reduce customers’ regular housing expenses, allowing them to start saving for multiple life goals. Irrespective of the financial health category an FSP improves, it is important for them to be aware of the existing gaps in their users’ financial health, and to take relevant action.
Principle 2: Financial health measurement should account for users’ means and intent
In figure 2 below, the X axis represents the steps the user has taken to use financial products to move toward different financial health categories, and the Y axis represents the user’s means – i.e., their ability to use these financial products. A user’s means is a function of their current income and responsibilities, and it plays a critical role in improving their financial health.
For each financial health category, there are four distinct possibilities (quadrants) where users can be currently placed, or where they can progress to in the future. Their position in each quadrant is determined by the minimum criteria they fulfill, as established by their FSPs. The ideal place for users to be is in the 1st quadrant, where they have the means to use appropriate financial products, and have taken steps to use those products to progress toward greater financial health. In the 2nd quadrant, users have the means to use financial products, but haven’t yet used them. The least favorable quadrant is the 3rd, where users neither have the means to use financial products, nor (predictably) have taken any steps to use these products to improve their financial health. And in the 4th quadrant, customers are using appropriate products, but sustaining this use is difficult due to their low means.

Fig 2. Defining financial health quadrants
FSPs should want their users to place in the 1st quadrant: Their task is to ensure that users move higher in the 1st quadrant or are nudged to move toward it from other quadrants (see figure 3 below). But pushing them from another quadrant to the 1st might be tricky, depending on their existing financial habits.
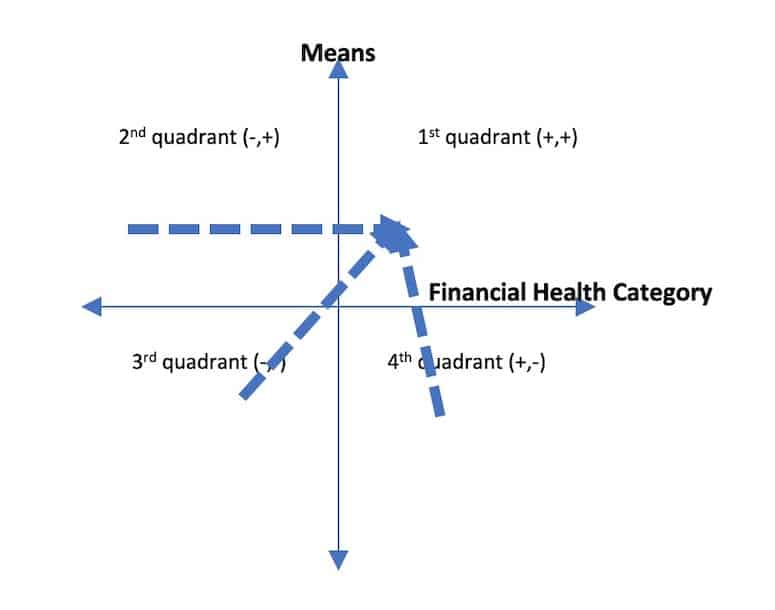
Fig 3. Ideal movement for a user’s financial health
Principle 3: Estimate the financial health range for different user groups, and focus on easy wins
Financial health scoring of this sort is comprehensive, as it takes into account users’ intent and means, not just their access to or usage of financial products. FSPs might have difficulty even deciding which user group to target, whereas knowing this score can enable them to not only improve their customers’ financial health, but to boost their own bottom line.
FSPs can put these scores into practice by focusing on the factors which impact the means of different user groups. For example, two user groups for our startup, Lakshya, are auto (tuk-tuk) drivers and artisans. According to our in-house research, there are several positive determinants which have an impact on their means, as described in the table below:
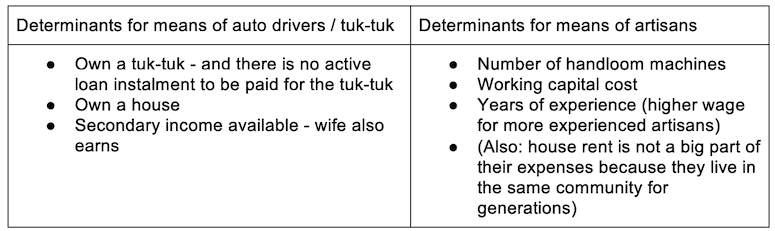
As a next step, we identified sets of auto drivers/artisans who: a.) have all of these positive determinants; b.) have few of these positive determinants; and c.) have none of these positive determinants.
Plotting a score for each set of auto drivers and artisans in a financial health category will give out a range of scores in different quadrants. By connecting the dots, FSPs will get a range of plausible financial health scores for these different subgroups, as shown in figure 4 below.
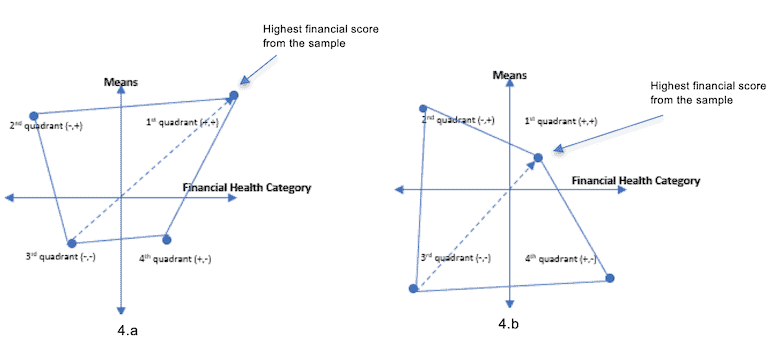
Fig 4. Range of financial health (representative)
The best-case scenario for the FSPs is 4.a (on the left), and a bad case scenario is 4.b. In the former, customers’ financial health scores place them more often in the 2nd and 1st quadrants, with fewer users falling into the 3rd and 4th. That means many users are either already using financial products and moving toward greater financial health (1st quadrant), or have the means to use financial products, but haven’t used them yet (2nd quadrant). So, pulling users from quadrant 2 to quadrant 1 is a task with high upside and low effort for FSPs. In contrast, in the latter scenario shown in 4.b, more customers fall into the 3rd and 4th quadrants, with less usage of financial products and less means to use them. So, pulling these users into quadrant 1 would be a task with low upside and high effort.
To track individual users’ financial health scores, FSPs can also invest in a self-reporting system and encourage users to track their financial health – and possibly to consent to share this data with the FSPs. This space is evolving, and with digital banking, artificial intelligence and machine learning, FSPs have a number of effective tools to measure customers’ financial health and link them with appropriate products more efficiently.
Conclusion
Financial health measurement methods are still nascent, and other institutions, like the Financial Health Network are providing frameworks of their own. But these efforts will require more debate and input from both customers and stakeholders to make them relevant for both service providers and their users.
FSPs should avoid one-size-fits-all methods to measure financial health. These methods were more suitable for financial inclusion. As we discussed in a previous NextBillion article, the measurement of financial inclusion is binary – either you have it or you don’t – while financial health, in contrast, is multi-dimensional and subjective. FSPs should experiment with broad frameworks – e.g., determining what sort of financial health design will help to measure people in the 3rd quadrant vs. the 1st quadrant of a financial health category.
An open, customisable, descriptive framework to measure financial health would be most suitable for financial institutions, enabling them to design their own financial health metrics aligned with their business needs. But for these efforts to gain traction across the industry, FSPs need quick wins to show the linkage between measuring customers’ financial health and positive business impact. To that end, we hope these insights will help encourage conversation, and action, among other providers in this sector.
Nishant Kumar is the founder and CEO, and Sonal Agrawal is COO and co-founder of Lakshya.
Photo courtesy of Josh McMillan.
You May Also Be Interested In:


- Categories
- Finance, Impact Assessment
