The Teacher-Researcher Divide: How Can Educators in Emerging Markets Make Better Use of Data?
Assessing the effectiveness of interventions in emerging markets education can often feel like an exercise in trial and error, as there has historically been little data to guide these efforts. But an explosion of interesting and high-quality research measuring learning outcomes has come out in recent years. This is a wonderful development for the field – we now have great information and insight on a range of interventions that are applicable to policymakers, ministries, school management organizations and individual schools, both public and private.
I’ve often wondered, though: How do practitioners interact with these studies, particularly the ones that have some implication for how teachers, learners and instructional design interact?
For instance, if you were to randomly sample 500 teachers, school leaders and curriculum support officers, how many would highlight the most demonstrably effective strategies for teaching and learning, as measured by this growing body of research?
I’m not sure. There are certainly outlier thinkers and organizations who skillfully combine rigorous research with large-scale education programming. But for the typical practitioner – or even one who’s unusually attuned to the latest research – it’s not always easy to find out what works. Indeed, it’s common for them to struggle to find out which programs have resulted in the most learning gains, as measured by standard deviations (which are kind of hard to follow anyway). And even for those who are willing to wade through multiple meta-studies, within these studies – alas – there doesn’t seem to be consensus on the big themes.
What’s more, when practitioners do dig into research, it’s not always obvious what underlying tactical pedagogy and tradeoffs it implies. For instance, can reading a study clarify the best ratio between large-group discussion and independent work? Can it help educators decide if they should focus on improving reading comprehension during a science unit if kids have trouble reading informational texts, rather than sticking with the original lesson plan? Not likely.
So instead, practitioners usually rely on different sources of information, which typically include their own experiences, intuitions and values, the performance of their pupils over time, and insights gleaned from their colleagues. And a paradox emerges, in which the best evidence on how children learn is underutilized by the very people who could put it to the best use.
If more educators could easily access the best evidence-led insight on what really creates learning, the impact for kids around the world would be staggering. Today, around 330 million children are in school but not learning the basics. In fact, in low-income countries, around 90 percent of children will reach the end of primary school age unable to read or do basic math. Meanwhile, there is a shortage of around 69 million teachers worldwide. Perhaps more people would be willing to teach if they were easily able to access the best guidance on what really boosts learning?
We can take cues from the World Development Report’s framing: “As brain science has advanced and educators have innovated, the knowledge of how students learn most effectively has greatly expanded.”
So, in the spirit of analyzing and sharing high-quality work, let’s look at two provocative graphs from recently released research. Both come from gold-standard studies, and both have implications for how we as teachers think about instructional design and the daily experience of pupils.
Supporting children from the bottom third of the performance distribution
This study from Muralidharan, Singh and Ganimian explores the impact of a personalized technology-aided after-school instruction program called Mindspark on learning outcomes in middle-school grades in urban India. The treatment group used Mindspark, which deserves congratulations for not only creating a great tool for kids but for committing to rigorously evaluating their program. This is a beautiful image from the report:
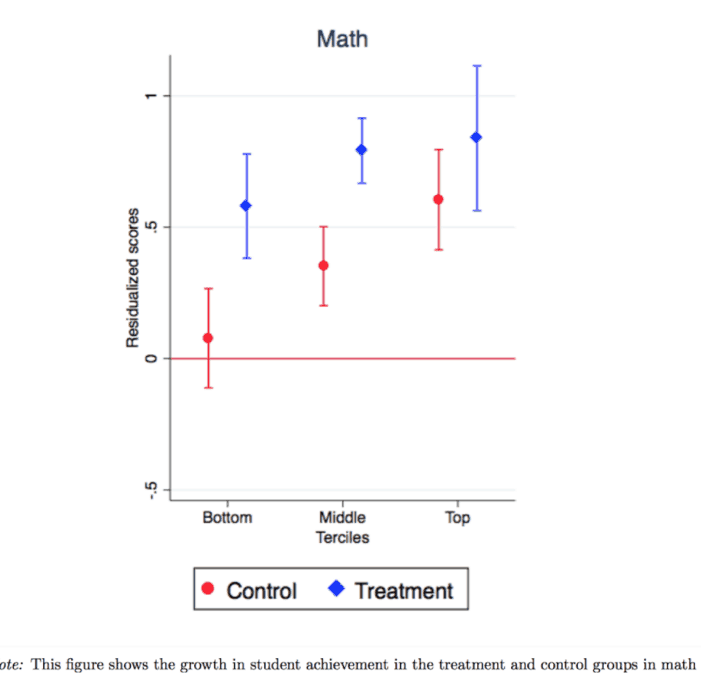
Look at that leftmost blue bar on that graph, which represents the test scores of kids in the bottom third of the distribution. By the end of the year, they have made much larger gains than their peers in the control group (in red) – and there is promising evidence for the middle and top terciles as well).
The researchers describe the significance of these results: “We find similar absolute test score gains for all students, but the relative gain was much greater for academically weaker students because their rate of learning in the control group was close to zero. We show that the program was able to effectively cater to the very wide variation in student learning levels within a single grade by precisely targeting instruction to the level of student preparation.”
From the practitioner’s point of view, what do I do with this information? An obvious path: I might learn every single detail of Mindspark, to figure out whether/how it works in the context in which I operate. If Mindspark is not available, I could still bring a systematic focus on the actual problems a child interacts with over the course of a math lesson. In particular, I’d focus on making sure EVERY kid has an entry point into the work, via instruction targeted to their level – and I’d empower teachers to respond to individual needs as they arise. This allows for a wide variety of pupils to access the content.
The consequences of failing to provide this sort of instruction can be found in the same quote: “…but the relative gain was much greater for academically weaker students because their rate of learning in the control group was close to zero.” Mindspark facilitated large gains for kids at the lower end of the performance spectrum by providing programs that were tailored to their needs. The alternative is something that, in the case of this study, may actually have done nothing at all! The researchers, when you look at the red bar for “bottom,” above, cannot rule out the possibility that kids in the control group learned “nothing” in math.
In the absence of programs like Mindspark, what are some other ways of creating this environment, where kids can access content at the right level? “Close to zero learning” is a low bar. We can – and should – make meaningful progress between Mindspark’s complete personalization, and no learning at all. (This general finding is backed up and corroborated by loads of studies).
The imperative to raise absolute learning levels in Liberia
I’m looking at a report about learning levels in Liberia in year 1 of the Partnership Schools for Liberia (PSL) initiative, a multi-year government partnership with eight private school operators, including Bridge International Academies. From a practitioner’s perspective, how much of this report could be informative or useful in improving learning outcomes?
The short answer is: A lot. We’re still working our way through it, but the online appendix of the report is a goldmine: The research team presents actionable intelligence on student attendance, teacher attendance, student engagement and parent engagement.
For now, let’s zoom in on Appendix H, where the focus is on “absolute learning levels.” The researchers contextualize the gains that Liberian pupils made over the course of the intervention. These data were fascinating, and I’d argue that they suggest where some of the public conversation should shift, even slightly.
One figure powerfully conveys the scope of the challenge in Liberia:
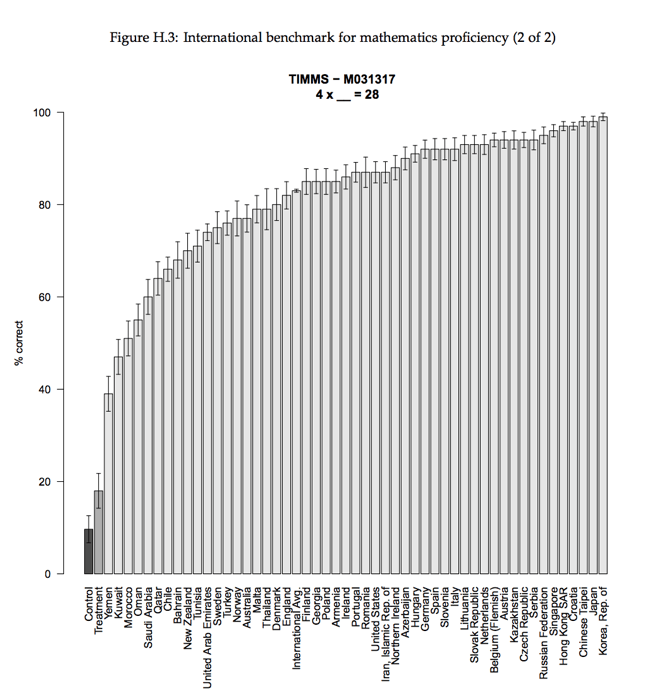
Look at the two leftmost bars in that graph, representing the control and treatment groups’ proficiency in mathematics: Those are the Liberian schools.
This makes for a really interesting “adventure in framing.” On one hand, yes, treatment outperformed control on this question, by statistically significant margins (we know this because the margin of error bars don’t overlap.) So we can credibly say that Partnership Schools for Liberia pupils made gains relative to the control group on this question. And we can perhaps further suggest (though of course, it’s only one question) that pupils are making gains on the underlying construct of conceptual mathematics.
But that framing would bury the lead. As the researchers say, “Note that absolute learning levels are low. Despite the positive treatment effect of PSL, students in treatment schools are still far behind their international peers.”
Agreed. The story here is the precipitous drop-off between Liberia and the rest of the tested countries. Look at the yawning gap between Yemen and “Treatment.” It’s an astonishing figure that should invite further investigation.
In that vein – now that we’ve established there may be a problem here – what does a practitioner do with this information? On the one hand, accessing this sort of big-picture data can help educators broaden their focus to include overarching context and performance trends emerging beyond their classrooms, which can also impact their own students. But to actually convert this knowledge into practical action, a teacher would need A LOT more information. Ideally, I’d hope practitioners would respond to this sort of data by saying, “Wow, overall, our schools look to be dramatically behind in teaching conceptual understanding – much further than I originally thought. If that trend holds true in our classroom, how do we make progress on that?” Perhaps a first step would be to check with their internal data, or other data sources that look at the same issue, to see if any patterns emerge. And indeed, within Bridge, our internal research corroborates the trend in this graph. Specifically in math, Bridge PSL pupils seem to be making gains on “procedural fluency” (according to Piper, Ralaingata, Akach and King) but less so on “conceptual fluency” and “strategic competence.”
We’ve tinkered with some solutions to address this in Year 2 of the program, and we’ll see if there is any uptick in performance. We’d also love to partner with any operators or international testing agencies who may be interested in addressing the question of absolute learning levels – perhaps by administering TIMSS, or an abridged and appropriately modified version of it in Liberia. In the meantime, we hope the education sector – both public and private, in emerging markets and globally – will move toward a future where the vital work of researchers is converted more directly into usable insights for practitioners.
Sean Geraghty is chief academic officer at Bridge International Academies, where he oversees a team focused on teacher support and instructional design.
Photo courtesy of Bridge International Academies.
You May Also Be Interested In:


- Categories
- Education, Impact Assessment
