Taking Control of the Value for Money Narrative: How Innovative Metrics Are Making Impact Part of the Financial Equation
As part of its effort to work toward 100% full financial sustainability, the nonprofit VisionSpring—which provides affordable, high-quality eyeglasses to base of the pyramid customers—piloted a new hub-and-spoke program model in Central America in 2014. As the model got underway, VisionSpring realized that it was shifting upmarket, serving more affluent customers rather than those who the enterprise was created to serve. Moreover, the work in Central America became increasingly costly and resource-intensive.
As VisionSpring considered whether to continue this new model in Central America, the leadership team recognized that they needed a better metric to assess the impact they were achieving versus the money being spent. A more traditional value for money metric (e.g.: the “$23 of economic impact generated per dollar spent” metric, which the organization had created primarily for funders) was not enough. VisionSpring needed a metric that could balance cost and impact, keep the target customer at the center of decision-making, and help inform decisions about which programs or geographies were good focuses for investments of limited time and resources. To meet this need, the organization created the Philanthropic Investment Per Pair (PIPP) metric, which .
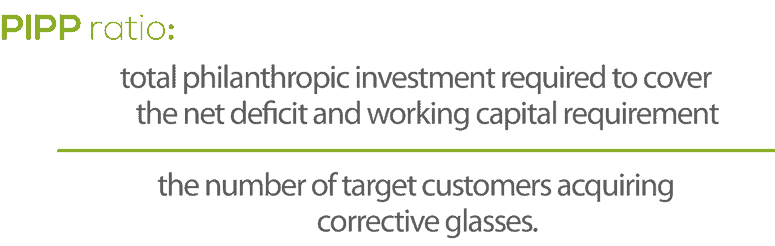
Figure 1: PIPP (Philanthropic Investment per Pair): Philanthropic investment required to provide one person a pair of corrective glasses
Using the PIPP Metric to Understand Costs and Impact
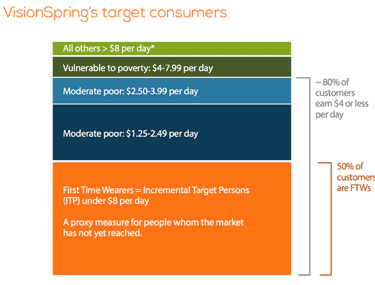
Figure 2
In its simplest form, PIPP is a ratio of the number of glasses sold and the amount of philanthropic capital required to sell them (i.e.: the difference between the full cost and the amount recovered through sales). For example, spending $20 of philanthropic dollars to reach five customers would result in a PIPP of $4 per customer served. But the brilliance of PIPP is the additional layers of nuance that VisionSpring added for its use. The organization creates PIPPs for its different programs and geographies to understand the costs of reaching different customers. It also ensures impact by setting program targets for different customer segments (e.g.: at least 80% of customers earn $4 or less per day, as shown in Figure 2).
VisionSpring can thus use PIPP to be sure that driving down costs does not sacrifice its intended impact. And although the metric does not give funders a number that they can easily compare across their portfolio (such as economic impact generated per dollar would), it does provide a quantitative way to look at value for money that can also account for differences between populations served—an important piece of data for many funders.
How can other enterprises use a metric like PIPP to work toward increasing financial self-sufficiency and/or cost efficiency while maintaining their commitment to mission? Through the Innovation Investment Alliance and CASE at Duke University’s Scaling Pathways interviews, some common themes emerged for how social enterprises are building and using this type of “programmatic value for money metric”—and we have broken them down into three types that build off of each other. While these metrics aren’t ideal for every type of organization, such as those in sectors with difficult-to-measure impact proxies like environmental sustainability and human rights, they can provide a strong starting point to help many organizations be sure that impact is part of the financial equation.
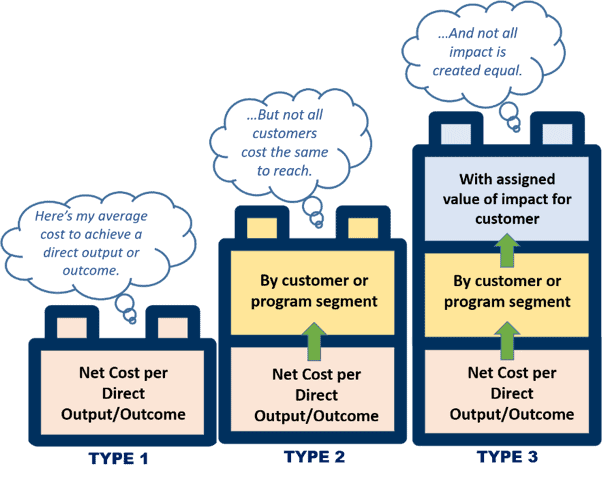
The Three Types of Programmatic Value for Money Metrics
We can summarize the three types as: 1) establishing the net cost to achieve a direct output or outcome, 2) disaggregating that number by customer or program segment, and 3) assigning a value of impact to each of those program or customer segments. The utility of any one type of these metrics for an organization depends upon its mission and objectives, the type of data it has available, and the extent to which cost per outcome is a key driver of its internal investment decisions. While the types build upon each other, one is not necessarily superior to another for any particular organization. Below, we’ll take a closer look at each type – and we’ve posted to this article on our website, which feature use cases and steps to calculate costs, if your organization is interested in learning more about these approaches.
Type 1: Cost per Output/Outcome – i.e.: What is the net cost to achieve my core, direct outcome or output?
At the base level, we are seeing enterprises assign a net cost to a direct output or outcome of relevance to the enterprise’s program. By relevance, we mean something within the locus of control of the enterprise that is meaningful (e.g.: VisionSpring’s pair of corrective glasses) versus a more distant outcome as would be used in more traditional value for money metrics (e.g.: the calculated economic value of corrected vision).
To take another example of this type of metric, Harambee Youth Employment Accelerator, currently operating in Rwanda and South Africa, builds solutions to tackle the youth unemployment challenge. It uses a “cost per candidate placed” metric, to be able to benchmark against other youth employment training/support programs and, in particular, to communicate that with key funders. Harambee also uses the metric to show efficiencies over time, in line with its drive to “do more or do it cheaper.” Importantly, the metric has also helped Harambee create a shared language between its finance and program teams, as both work toward goals that can sometimes feel in conflict.
Type 2: Cost per Output/Outcome Broken Down by Customer Segment – i.e.: What is the net cost to achieve my core outcome/output for specific customer segments?
This type of metric explores the difference in net cost to reach different customer groups, acknowledging that some customers may cost more to serve, and some less. (If your organization is unable to separate customer groups in your cost accounting, you can find alternative options in the “How To Calculate” section in the to this article.)
For an example of this type of metric, let’s look to MiracleFeet, which supports and equips clinics around the world to provide treatment to children born with clubfoot. It has a “cost per child treated” metric, and it disaggregates that number by country of operation, so it can compare the cost per child treated in one country versus another. MiracleFeet uses the metric to drive budgeting, shift donor expectations, and inform internal decisions about where to invest precious resources.
Type 3: Value of Impact for Specific Customers – i.e.: What is the subjective value of the impact on each of the customer segments?
This third type of metric assigns a subjective value or weight to the impact for each customer grouping, based on factors such as poverty level, additionality, risk, age, gender, rural/urban location, etc. This approach acknowledges that although some groups may be more costly to reach, the impact on those groups might be more transformative – and therefore worth the extra investment.
One Acre Fund, which supplies smallholder farmers with financing and training to help them boost their incomes, provides an example of this approach. Its Type 1 metric assesses the net cost to achieve $1 incremental profit per farmer. It then further disaggregates that number by operational region (i.e.: Type 2). Finally, as related to Type 3, it categorizes regions into high need and low need based on poverty level (using pre-intervention farmer income as a proxy), and sets different targets for each category. As One Acre Fund discusses in “How Nonprofits Can Drive Healthy Growth Using SROI,” this type of metric helps it to articulate key aspects of its impact, demonstrate trade-offs, and systematically consider cost and impact data together.
A Caveat
It’s important to note that the calculation of these programmatic value for money metrics, and of Types 2 and 3 in particular, may not be possible or justified for certain types of organizations. For example, for organizations working in sectors such as democracy, human rights or environmental sustainability, direct impact proxies can be hard to name or measure. And for organizations that have little risk of deviating from their target markets, or those that are largely dependent on donor priorities to drive investments, the work required to calculate Types 2 and 3 of the metric may not justify the resulting benefit.
Programmatic value for money metrics can be a powerful way for social enterprises to define and articulate their depth of impact and cost by customer segments. This effort can inform programmatic decisions, and help shift their funders’ conceptualization of impact away from a more generic, indirect measure (e.g.: social value) to something more nuanced. While a number, in and of itself, is an imperfect way to consider impact, it provides a common language to consider trade-offs between cost and impact.
Scaling Pathways is a partnership between the Skoll Foundation, USAID, Mercy Corps Ventures and CASE at Duke to curate and share scaling insights from the world’s leading social entrepreneurs.
:
- Use Cases for Programmatic Value for Money Metrics
- How to Calculate Three Types of Programmatic Value for Money Metrics
Erin Worsham is the executive director and Kimberly Bardy Langsam is senior program director at the Center for the Advancement of Social Entrepreneurship (CASE) at Duke University’s Fuqua School of Business; Ellen Martin is the managing Director at SoJo.
Photo courtesy of Nathan Dumlao.
You May Also Be Interested In:


- Categories
- Impact Assessment, Investing, Social Enterprise
