Assessing Last-Mile Distributors’ Business Performance and Impact: Using a Diagnostic Tool to Reveal Key Areas of Strength and Improvement
Running a company without business data is like driving a car without a dashboard: Not knowing your monthly expenses is like not knowing how much gas you use per mile. However, it is not always easy for an entrepreneur to determine which data is important to track, and how to use it to evaluate their business’ performance.
At Hystra — in collaboration with the Global Distributors Collective and with support from British International Investment’s Last-Mile Distribution Technical Assistance Programme — we’ve leveraged our experience working with over 100 last-mile distribution companies across low and middle-income countries to build an auto-diagnostic tool that enables these companies to assess their business performance and identify key areas of improvement. The tool is segmented along three axes that are key to driving value-creation and impact:
- Do you have a holistic value proposition?
- Is your delivery model cost-effective?
- Are you equipped to grow?
These broad axes cover 15 key performance indicators (KPIs), each associated with a three-tier benchmark (best practice, good, to be improved), on which companies can rate themselves. The tool has been used by over 60 companies, and we hosted a webinar earlier this year, explaining how to use it.
This article takes a deeper look into the diagnostic tool’s three axes, delving into six of the 15 associated KPIs and their corresponding benchmarks, highlighting their importance, and providing examples from best-in-class organisations that show how each KPI can be utilized.
Axis 1: Do you have a holistic value proposition?
A holistic value proposition is an offer which is attractive, competitive, affordable and, in the impact space, inclusive. The following KPIs can help distributors determine whether their products meet this description.
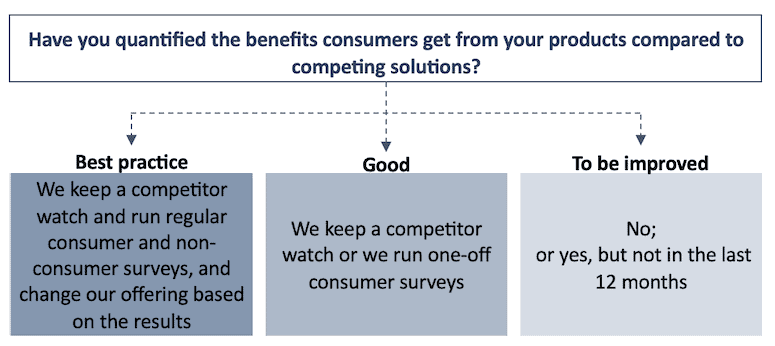
KPI: Understanding of your unique value-add: Have you quantified the benefits consumers get from your products compared to competing solutions?
A first step towards building a holistic value proposition is to know not just why your consumers buy your product, but also why your non-consumers do not — and to determine what value you’re adding (if any) compared to your competitors.
That’s what Jumia, a leading pan-African e-commerce platform, did when it started expanding its network to Africa’s so-called “secondary cities” (i.e., those with less than 100,000 inhabitants) in 2019. As these cities had very different population profiles compared to the larger cities Jumia typically served (lower income, less digitally savvy), the company needed to understand this different segment in order to adapt its product offering, messaging, etc. Surveying consumers helped Jumia identify that “cost savings” and “access to products otherwise unavailable locally” were the two key factors driving sales, and it tailored its subsequent promotional efforts toward highlighting these benefits. Further, surveying non-consumers revealed that close to a third of them were not buying simply because they were unaware of the company’s presence in their city. This prompted Jumia to create local radio ads indicating locations where people could pick up its products, thus accelerating these products’ penetration.
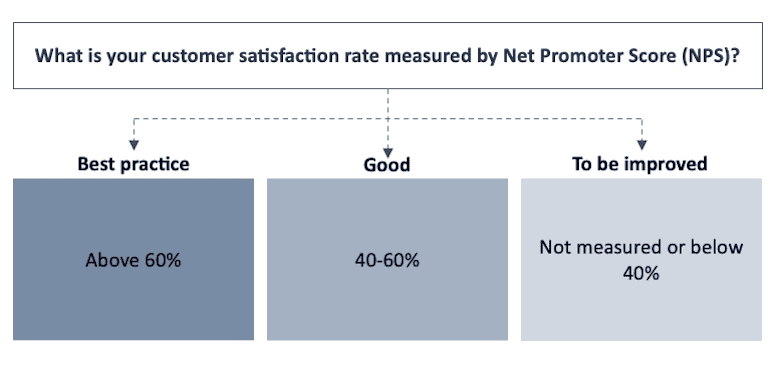
KPI: Net Promoter Score (NPS): Would your clients recommend you to their friends and family?
Another test gauging the attractiveness, competitiveness and affordability of a business offering is the assessment of clients’ satisfaction. A large percentage of low-income customers make purchasing decisions based on a recommendation from relatives or neighbours, hence your existing customers’ likelihood to recommend your product or service to others is a key indicator to monitor and act upon. This can be measured with the NPS, which entails asking customers, “On a scale of 0 to 10, how likely are you to recommend the product/ service to a friend or family member, where 0 is not at all likely, and 10 is extremely likely?”. The NPS is calculated by subtracting the percentage of detractors (customers with a rating of 6 or lower) from the percentage of promoters (those with a rating of 9 or 10). The NPS can be expressed either as a percentage (e.g., 40%) or as an absolute figure (e.g., 40, such as in the 60 Decibels benchmark)
This KPI was used successfully by Patrimonio Hoy, a subsidiary of the cement manufacturer CEMEX that sells home improvement packages, including support services and financing options in addition to building materials. The company was able to reach an NPS of over 80% across its portfolio. To achieve those excellent results, it measured the NPS every month, for every aspect of its product offering. In fact, Patrimonio Hoy even tied its staff members’ client-facing compensation to their individual NPS. This meant sales agents, architects providing construction advice, and delivery staff were incentivised to identify and follow up with dissatisfied customers, preventing negative word of mouth — which can be a particularly powerful market-killer in low-income communities.
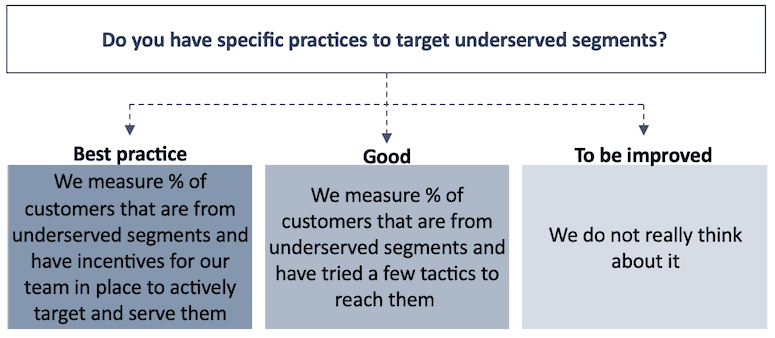
KPI: Inclusivity: Do you have specific practices to target underserved segments?
Even though increasing inclusivity is not a requirement for a business to succeed, not pursuing this strategy might result in missed business opportunities.
BRAC, one of the largest NGOs in the Global South, provides an example of the business impact of boosting the inclusion of underserved customer segments. It scaled up its Water, Sanitation and Hygiene (WASH) program in Bangladesh by making latrines affordable for all through segmented offerings:
- For the non-poor, it provided technical support for the installation of septic tank latrines with brick walls and ceramic pans;
- For the poor, it gave microloans through its WASH microfinance program for the construction of twin pit latrines with steel sheet superstructures;
- For ultra-poor households, it offered subsidies (from BRAC itself and via government partnerships) for the construction of twin pit latrines with bamboo superstructures.
As a result, BRAC managed to improve access to sanitation for 25.8 million people in 40,000 villages, increasing latrine coverage from 33% to 83%.
Axis 2: Is your delivery model cost-effective?
The second axis that’s key to value-creation and impact is the efficiency and effectiveness of the delivery model, which can be assessed via a range of KPIs. We’ll discuss two of these KPIs below: sales agent churn and process digitisation.
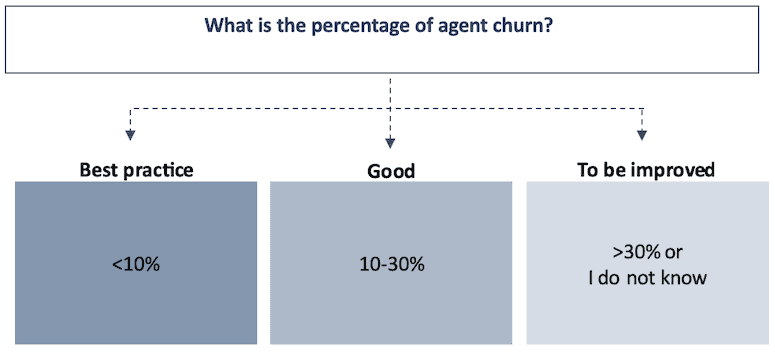
KPI: Sales agents churn: How successful are you at retaining your agents?
When it comes to last-mile distribution, a high agent churn (i.e., the percentage of sales agents quitting per year) can quickly become a heavy burden, and considerably increase costs (e.g., the time required to recruit and train new agents, etc.).
Hystra has analysed compensation, career opportunities and financial/non-financial recognition of strong performance for agents across direct-to-consumer businesses in different geographies and sectors. We’ve found that best-in-class organisations manage to get churn below 10% thanks to a combination of competitive packages for their sales agents (including fixed salary) and close management (ideally below eight agents per manager — though with increasing digitisation, managers today may be able to effectively manage a slightly higher number). But overall, remaining under 30% churn would be considered a good performance, especially for companies that do not offer a fixed salary.
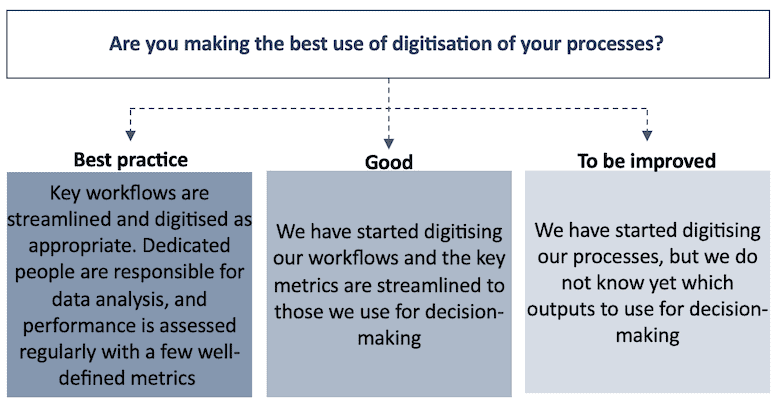
KPI: Process digitisation: Are you leveraging IT optimally to support your delivery model?
Making the best use of process digitisation can save a lot of time and money — as long as digitisation is adapted to the realities of last-mile regions, and especially to rural ones.
A business that excels at identifying where to digitise (or not) is Copia, an innovative e-commerce company working with small retailers to provide centralised ordering and drop-off points, enabling consumers to order its products, pay, and pick up the order two to four days later. Although much of its operation is highly digitised, Copia has been careful not to over-digitise where it is unnecessary, or where digitisation does not make sense for its client base. For instance, although it provides tablet computers to the retailers it works with, listing the entire catalogue of Copia products that can be ordered online, it also gives them physical, paper catalogues that some consumers find easier to use. At the back end, the company leverages data to optimise the aggregation of orders and logistics, keeping its costs low. This innovation helped Copia win the Africa Supply Chain Excellence Award in 2022.
Axis 3: Are you equipped to grow?
Being equipped to grow means having not only financial performance that enables growth, but also the right capabilities to anticipate and adapt for the future.
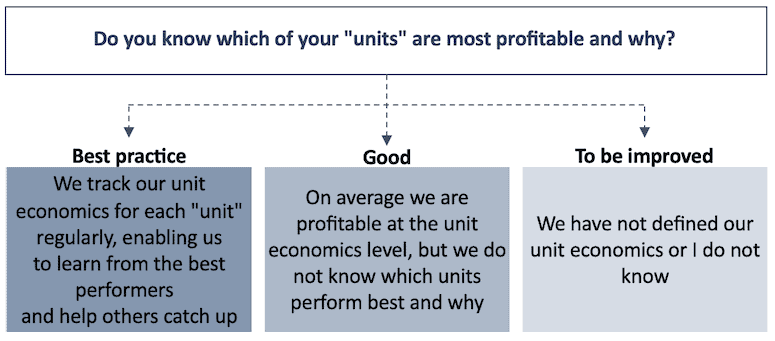
KPI: Unit economics: Do you know which of your “units” are most profitable and why?
To determine if current financial performance enables growth, a unit economics exercise is key. A unit refers to any basic, quantifiable item that creates value for a business — ideally as close to customers in the supply chain as possible. For instance, a unit could consist of one sales agent, one shop or one distribution vehicle, and obviously this will differ across sectors and business models.
For example, Hystra helped an e-commerce platform conduct its unit economics analysis, enabling it to better understand the profitability of key units for its business: its points of sales (POS). The analysis revealed vast differences between the monthly sales figures and profitability of the various POS. This enabled the company to identify best practices at high-performing POS, which it used to help improve profitability among the under-performers, and ultimately increase the average performance across POS.
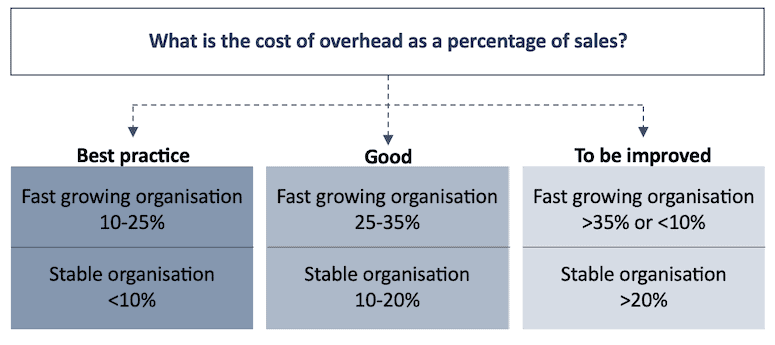
KPI: Overhead as a percentage of sales: Do you spend too much or not enough on your management team and systems?
In order to grow, a business needs to have the right management team and systems in place. One KPI that can help assess whether a company is investing enough — or possibly too much — in these areas is the ratio of overhead as a percentage of sales. Overhead can be defined as any selling, general and administrative expenses that go beyond what is typically included in the unit economics analysis. In other words, it includes any costs that cannot be directly linked to sales, such as expenses related to the company’s local back office, general management, recruiting and training (other than the ones done by sales managers), fundraising teams, and impact monitoring.
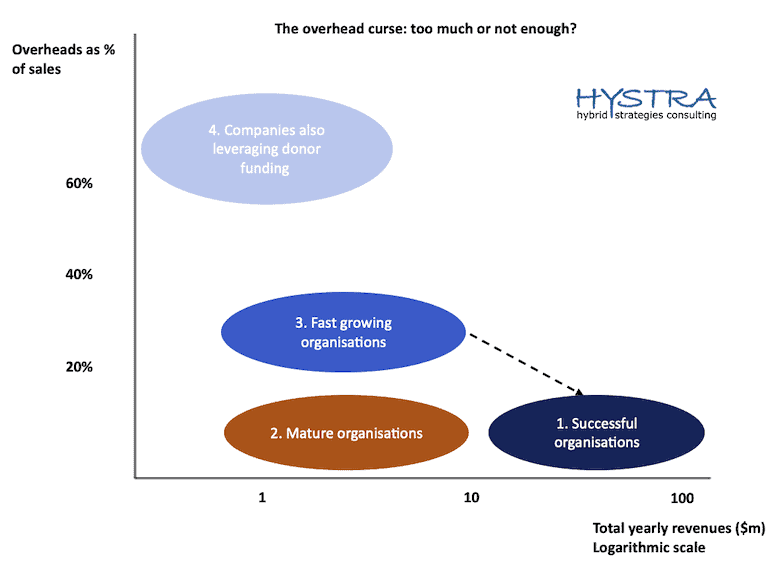
Based on last-mile distributors Hystra has studied over the years, there are four archetypes of organisations with over US $1 million in revenue in terms of overhead spend, corresponding to different growth and funding strategies:
- Very large, successful organisations (with over $10 million in sales revenues) have overhead below 10% of revenues, while benefiting from well-established professional management structures (e.g., finance, human resources, etc.) led by qualified managers.
- Some mid-size organisations (with $1-10 million in sales revenues) have voluntarily maintained low overhead as a percentage of sales, often by sticking to social sector salary levels that are below the salaries paid to equivalent positions in the commercial sector. These players generally maintain their current size or grow slowly, but with this low level of investment overhead, they typically fail to achieve double-digit growth.
- In contrast, fast-growing mid-size organisations invest ~30% of their revenues in building professional overhead, with the hope that this number will decrease to ~10% as they grow and join the ranks of the first group. However, if these companies lower their overheads below 10% too soon, this may reduce their ability to continue their rapid growth.
- A last group, comprising organisations of various sizes, has made a “big bet” in investing substantially in their overhead from the beginning. These organisations are typically heavily donor-dependent, which in turn explains their high overhead, as they have high fundraising expenses (including the impact monitoring that’s often requested by donors). These organisations have only a few years to demonstrate that they can innovate enough to reach scale sustainably: Donors are likely to lower their funding at some point, expecting them to truly become self-sustaining — particularly since they often put forward a “sustainability” argument in their fundraising pitch.
Moving forward
An initial assessment using this diagnostic tool can enable you to pinpoint the key levers of improvement in your business — a process that can bring quick, significant results that boost the health and impact of your organisation.
The following resources provide more information about the tools and practices discussed above, offering further insights on how to improve these KPIs for your business:
- Marketing Innovative Devices for the Base of the Pyramid: Lessons from 15 global pioneers that challenge conventional sales and marketing approaches to successfully serve the poorest (Hystra, 2013)
- Mindset drives success: Selling beneficial products at the base of the pyramid (Hystra, 2021)
- Expanding online marketplaces across secondary cities – lessons from Côte d’Ivoire (BII, 2022)
If you are keen to learn more about this topic, you can watch the full webinar hosted by the Global Distributors Collective and British International Investment. Contact the Hystra team to continue the conversation: lklarsfeld@hystra.com; amagand@hystra.com.
Lucie Klarsfeld McGrath is Partner at Hystra and co-founder of the Global Distributors Collective; Alice Magand is a project manager at Hystra; and Chitraksh Sharma is a consultant at Hystra.
Photo courtesy of Chris Bird.
You May Also Be Interested In:


- Categories
- Technology
