Do Surveys Fall Short? Solving the Challenge of Predicting Mini-Grid Energy Usage in Africa
Half of Africa’s population is living without electricity. CrossBoundary analysis has previously shown that mini-grids are the cheapest way to connect at least 100 million of these 600 million people, but they are still too expensive to profitably connect these potential customers. One central challenge is the high costs associated with building a grid with either too much or too little generating capacity relative to customer demand. If a 30 kW mini-grid achieves a 12.5% internal rate of return (IRR) when right-sized to customers’ actual energy usage, oversizing the grid by 100% cuts the IRR by more than half – down to just 6.1%. This is too low for a project to be commercially viable. That’s why one East African mini-grid developer described accurately forecasting demand as “the single biggest challenge developers face.”
What makes it so difficult to predict energy consumption at a site? Electricity demand is influenced by numerous factors, and it is challenging to isolate the relative importance of each factor and understand how they interact with each other. A village on Lake Victoria, for instance, may have a high demand for charging fishing lights that allow people to fish at night. Older customers may see less need for electricity, since they’ve lived so long without it. A rural site far from a major city yet connected by high quality roads may be more accessible for mini-grid developers to visit, allowing them to promote the use of electricity and gain the community’s trust. Turning these multiple amorphous variables into a precise estimate of the site’s future energy usage is difficult. However, combining known customer behavior with increasingly granular site characteristics from operating mini-grids may allow us to leverage past experience to predict the future.
The Mini-Grid Innovation Lab, established by CrossBoundary Advisory and The Rockefeller Foundation in 2018, and supported by Energy4Impact, works with mini-grid developers to identify and test innovative prototypes that improve the business model. As the prototypes generate results, the Lab shares evidence on their impact, and works closely with partners – developers, governments, and funders – to scale these prototypes across participating developers and markets. With over 550 million data points on customer behavior across 62 sites in four countries, gathered from seven prototypes undergoing testing, the Lab is helping developers use historic patterns to accurately estimate energy demand at new sites. In this article, we discuss our findings to date.
Using Machine Learning to Predict Individual Mini-Grid Customers’ Energy Consumption
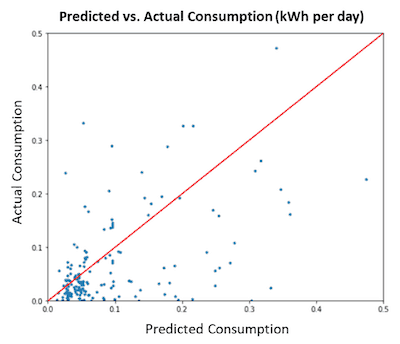
Note: Each blue dot represents a customer. It indicates what the model predicts their consumption to be, relative to what their actual consumption was. The red line indicates perfect predictions: Dots falling on this line are customers whose predicted values are identical to their actual values.
In 2019, the Lab partnered with DataKind, a nonprofit which conducts data science projects with mission-driven organizations, to develop a model to forecast electricity demand based on customer survey responses. We combined almost two years of consumption and payment data with survey responses from customers at 31 mini-grids across East Africa.
Using machine learning techniques, our analysis shows that each customer’s survey responses are not predictive of their individual consumption. The Lab’s best-performing survey-based model, using random forest regression, predicted demand with a 65% error rate – if a customer’s true consumption was 10 kilowatt hours (kWh)/month, the model might predict their consumption to be as high as 16.5 kWh/month, or as low as 3.5 kWh/month. These results aren’t accurate enough to lead to a commercially viable project IRR.
The model’s high error rate is due to the minimal predictive power of the survey data on customer-level consumption, suggesting customers’ responses provide either inaccurate or irrelevant data about their individual demand. Out of the 300 variables collected in the survey, self-reported electricity consumption is most predictive of actual electricity consumption, with a predictive power score of 12%. This, however, can’t be provided by customers at new sites, where households are not yet connected. The other survey variables provide negligible predictive power – less than 0.3% on average. The “representative results” line in the graph below demonstrates what the results would be if 20 variables had meaningful predictive power and could therefore be used to better predict consumption, and compares these hypothetical results to the actual results based on our survey data.
This finding is in line with recent research by academics such as Blodgett et al. (2017), Hartvigsson et al. (2018), and Louie and Dauenhauer (2016), which found consumption prediction errors of up to 305% based on survey responses. Asking customers about a product – electricity – they’ve never, or only recently, had access to, does not appear to be an effective method to accurately forecast their individual demand.
*“Feature Importance” is a measure of the predictive power of the variable
† “Feature Rank” ranks each variable in order of predictive power
However, analysis by the Lab’s partners suggests that combining all customer-level predictions at a site improves the accuracy of site-level consumption estimates, even if each individual prediction is inaccurate. Given the importance of site-level estimates, the Lab is conducting ongoing analysis to robustly quantify this prediction error. It’s also possible that different survey data could be collected which is more accurately predictive of site-level consumption, but we must better understand what data is most valuable. For instance, analysis conducted by the Lab shows that 75% of electricity at a site is consumed by 25% of customers. Surveys focused on identifying the number and needs of these “anchor” customers at a site may be more effective at predicting demand than those conducted with all households.
We acknowledge that conducting site surveys as currently designed may be worthwhile in the absence of an alternative approach. Spending an additional $8 per connection on surveying is small relative to the average overall upfront cost per connection of approximately $1,000. However, the Lab’s financial modelling shows that every 10% in sizing error reduces project IRR by 0.6% – 0.8%. This means if a mini-grid has a 12.5% project IRR when perfectly sized, oversizing it by 50% would reduce its project IRR to 8.5-9.5%. Raising financing for a mini-grid at this level of project IRR would still be very challenging. Developers should not be satisfied with relying on any means of predicting customer consumption that reduces IRRs so significantly – and it’s not assured that more effective surveys could reliably improve these customer predictions’ accuracy.
Using Alternative Datasets to Make Better Site-level Energy Consumption Predictions
Fortunately, there are additional approaches to demand estimation that might generate more accurate predictions, taking the unique characteristics of the local market into account. Importantly, there is substantial variation in electricity usage across sites. Comparing median monthly consumption per customer across 13 different regions, we find consumption in some regions is up to six times higher than in other regions within the same country. In line with the Lab’s rapid and iterative testing approach, we are identifying new methods to more accurately predict consumption based on the site characteristics that are likely driving these differences.
We are building on the work of others in the energy access sector – including mini-grid developers themselves – to identify high-quality datasets and the best techniques for demand prediction. The Lab is collaborating with the e-GUIDE Initiative, led by two of our academic partners, Jay Taneja of the University of Massachusetts Amherst and Nathan Williams of Carnegie Mellon University, and funded by Rockefeller Foundation. The Lab expects to produce a robust machine learning model that can accurately predict mini-grid consumption, trained and validated by combining our database of consumer behavior with geospatial datasets, such as maps of roads, grid lines, types of economic activity and weather patterns.
It’s important to emphasize that the findings presented here represent actionable intelligence rather than scientific evidence. These are preliminary results, and they may change as more data comes in over time, from additional sites and other markets, or via alternative analytical approaches.
The full results and analysis are published here, in the third paper in the Lab’s Innovation Insight series (see the first paper on the impact of reducing tariffs here, and the second on the effects of appliance financing here). This series provides ongoing, early insights on the prototypes we’re testing, so mini-grid developers, governments and funders can act on the results as they emerge.
The Lab is endorsed by the African Mini-Grid Developer Association (AMDA) and supported by the University of Massachusetts Amherst, Carnegie Mellon University, and Duke University, who provide advice and support on experiment design, survey design, and analysis of results.
Jane Dougherty is an associate, Erika Lovin is Innovation Lab Lead and Gabriel Davies is Head of Energy Access at CrossBoundary.
Photo courtesy of IRENA.
You May Also Be Interested In:


- Categories
- Energy, Technology
- Tags
- data, energy access, off-grid energy, research
